We Are Sports Nerds. Unapologetically.
Analytics207 started the way most passion projects do -- late nights, spreadsheets that got way too big, and the persistent feeling that Maine high school sports deserved better data. Not better coverage (Maine has incredible local coverage), but better numbers. The kind of numbers that make you lean forward at the kitchen table and say, "Wait, really?" Does anyone else miss the box scores in the Bangor Daily News?
We are not a media company. We are not trying to replace anyone. We are a group of sports-obsessed data people who believe that the stories hiding inside box scores are some of the best stories in sports -- and nobody was telling them.
One Platform, Six Sports, Six Different Models
Here is something most people do not realize: you cannot use the same GameIQ for every sport. It sounds obvious when you think about it, but it is the single biggest mistake in amateur sports analytics.
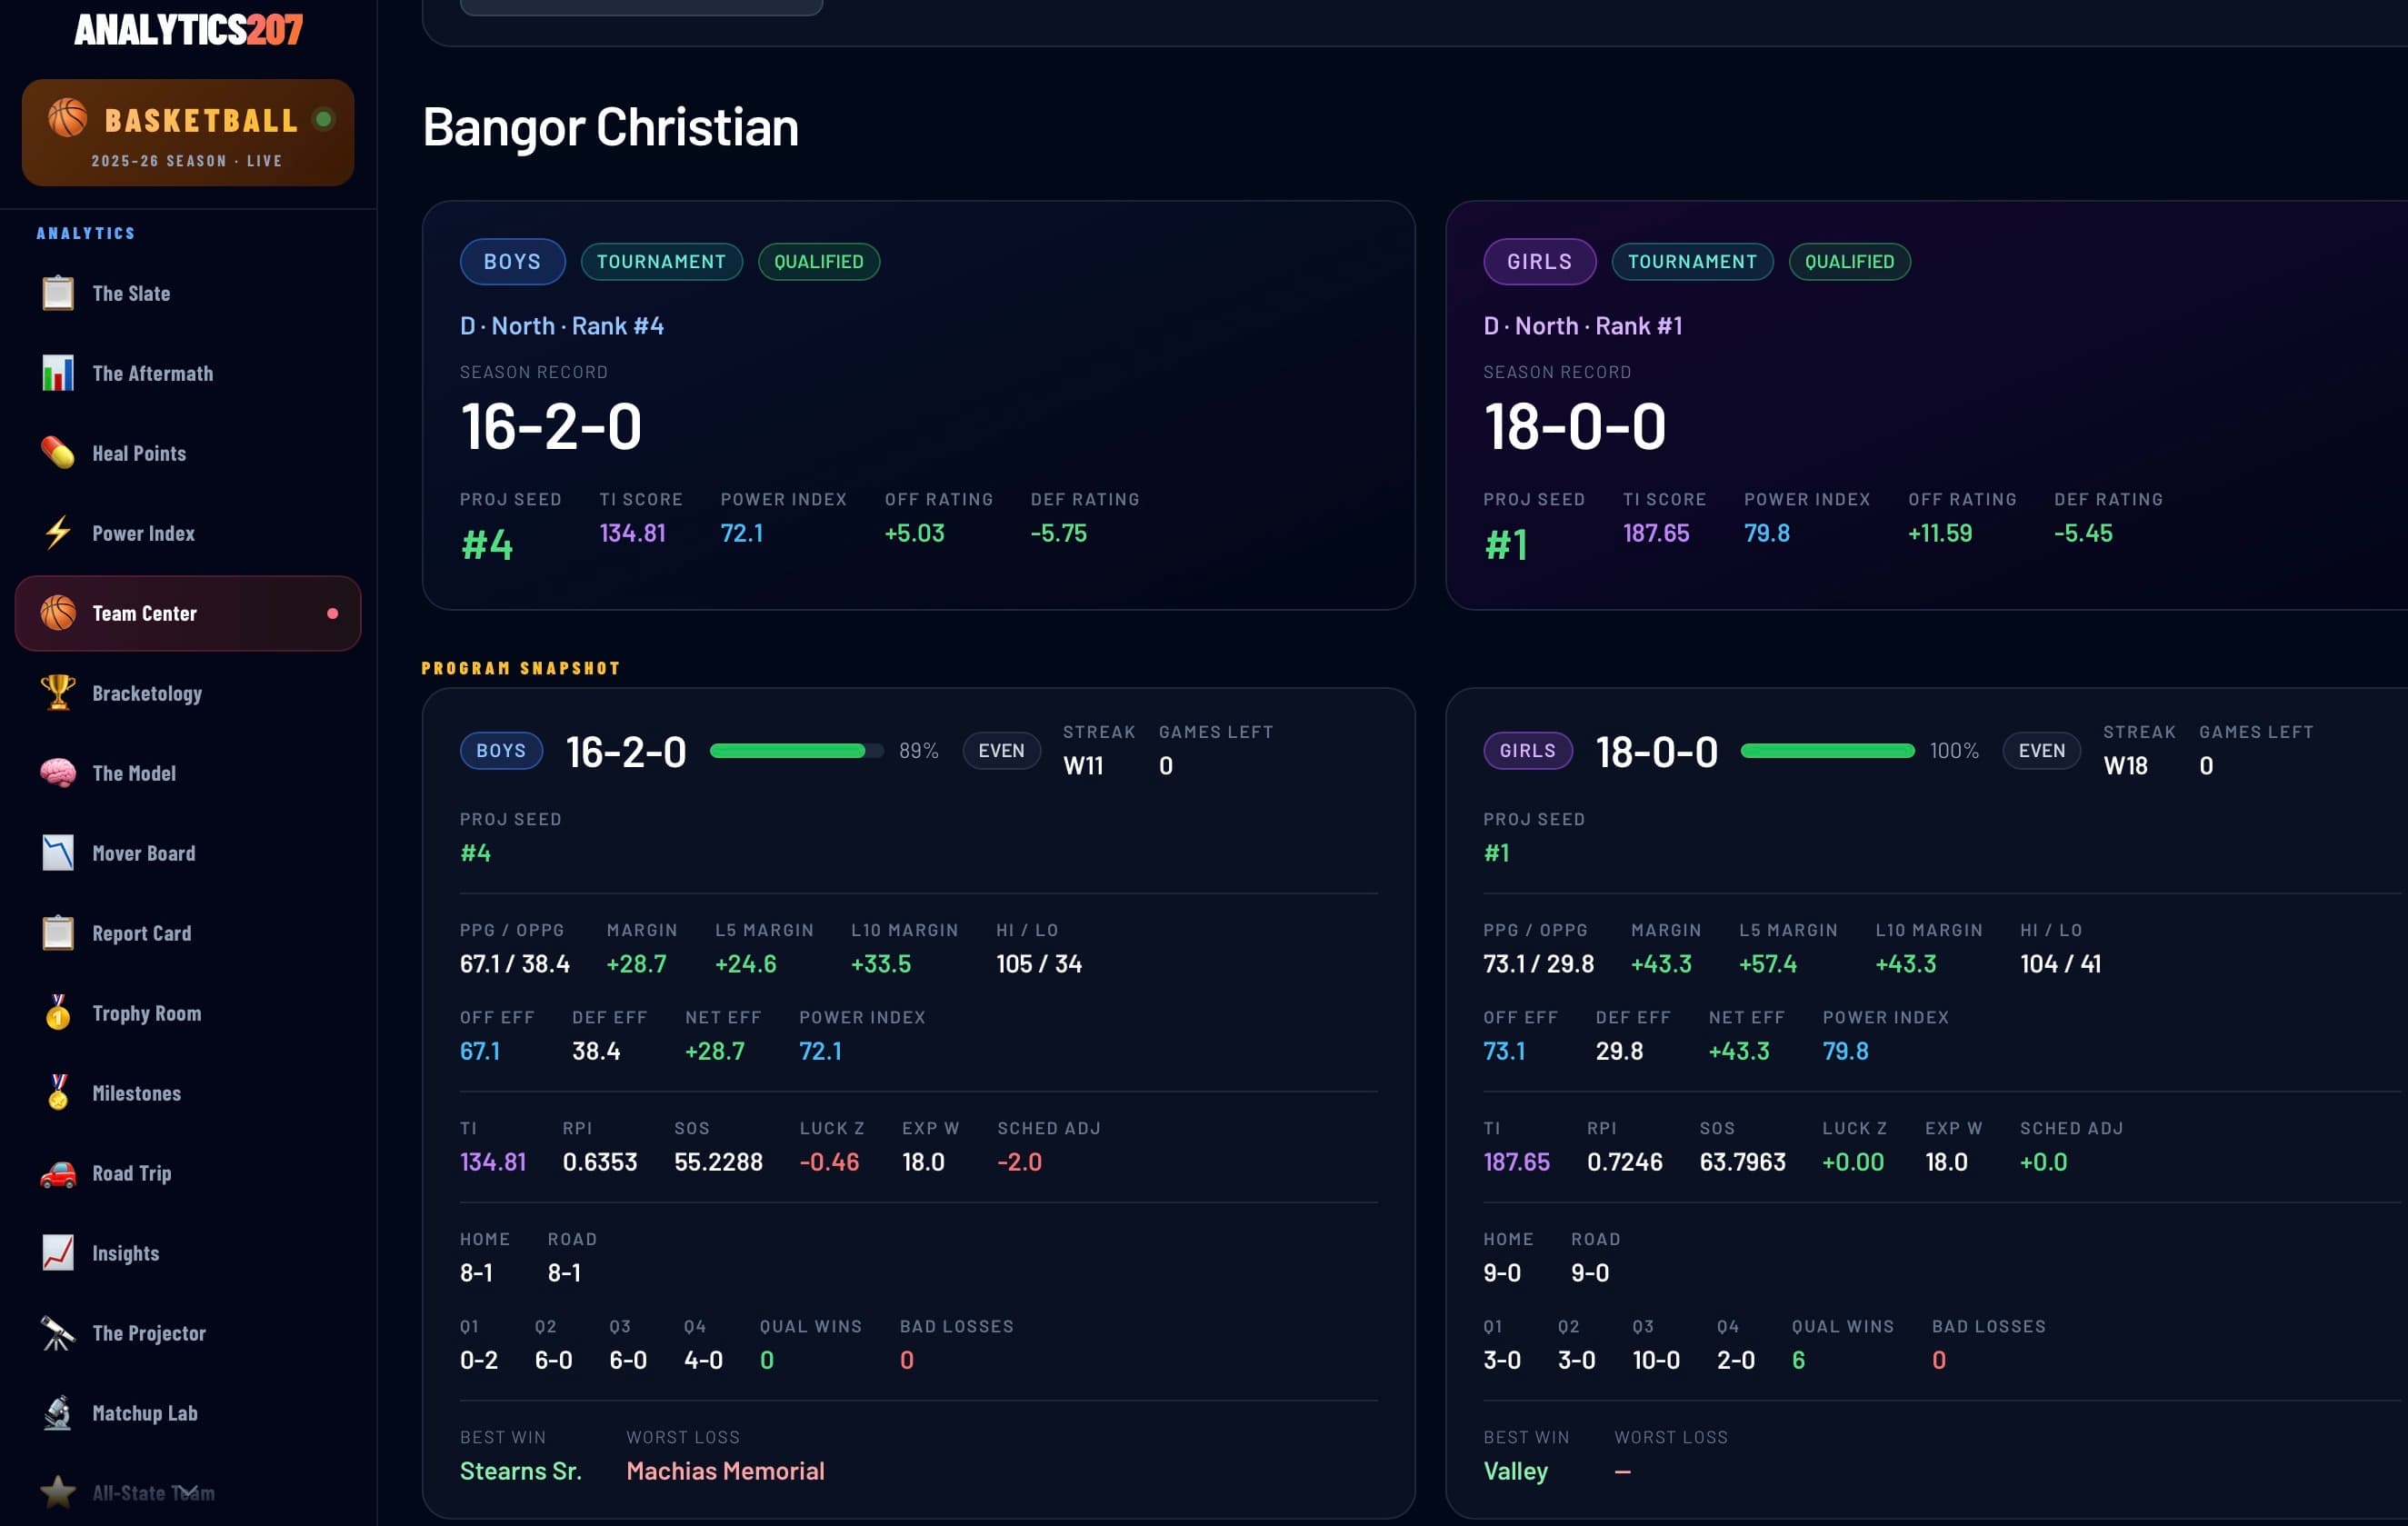
Basketball is high-scoring, high-possession, and relatively predictable. A team that scores 75 points per game and allows 40 is probably going to beat a team that scores 50 and allows 54. Efficiency metrics translate beautifully. Our basketball GameIQ leans heavily on net efficiency, strength of schedule, and pace-adjusted scoring.
Baseball and softball are completely different animals. Runs are scarce. A single pitching performance can dominate an entire game. Pythagorean win expectancy -- the idea that your run differential predicts your true winning percentage -- is one of the most powerful tools in all of sports analytics, and it shines in baseball and softball. GameIQ here focuses on run production, run prevention, and the gap between what your record says and what your runs say.
Hockey is somewhere in between -- lower scoring than basketball but more fluid than baseball. Goal differential matters enormously, but so does the chaos factor. Hockey has more randomness per game than almost any other sport. GameIQ accounts for that by weighing strength of schedule more heavily and using a Poisson-based approach to expected goals.
Cross country is the most fascinating challenge of all. There are no opponents in the traditional sense -- you are racing a clock and a course. GameIQ is a hybrid, XC times are noisy. A kid who runs 17:30 one week might run 18:45 the next because of hills, weather, or just a bad day. We tested twelve different prediction GameIQs and hybrid combinations before creating a GameIQ that we currently like.
Soccer brought its own puzzle: ties. You cannot ignore draws the way you can in most American sports. Our soccer GameIQ uses another hybrid GameIQ that accounts for the low-scoring, tie-heavy nature of the sport. With 89% walk-forward prediction accuracy, it has been our most surprisingly effective GameIQ.
The Honest Truth About Our Limitations
We believe in being upfront about what we cannot do.
We do not have individual player data. This is the single biggest limitation in high school sports analytics. We cannot tell you that a team is about to lose their ace pitcher to graduation, or that a freshman point guard is about to break out. College and pro analytics live in a world of player tracking data, pitch-by-pitch logs, and shot charts. We have box scores and schedules. That is it.
But here is the thing -- we have fought hard to squeeze every drop of insight out of what we do have. Run differentials, margin analysis, home-away splits, strength of schedule, close game performance, streaks, blowout rates, Pythagorean records -- the amount of signal hiding in team-level data is staggering if you know where to look.
Scheduling inconsistency is another real challenge. Not every Class A team plays every other Class A team. Some conferences are deeper than others. A 15-3 record in one conference might be more impressive than a 17-1 record in another. Our strength of schedule metrics exist specifically to address this, but it is an imperfect science.
Small sample sizes plague high school sports. A baseball season might be 18-20 games. That is barely enough data to draw confident conclusions. We use techniques like Bayesian regression toward the mean and Pythagorean expectation specifically because they are designed to extract signal from small samples -- but we will always be honest when the data is too thin to say anything meaningful.
Our Vision
We want Analytics207 to be the place Maine high school sports fans go when they want to understand why things are happening, not just what happened. Why is that 10-5 team actually more dangerous than the 14-2 team? Why does Team X dominate at home but struggle on the road? Which teams are lucky, which teams are good, and which teams are both?
We want coaches pulling up our site during practice planning. We want fans using our predictions to make their Friday night arguments better. We want that kid in the stands who loves math to see that sports analytics is not just for billion-dollar franchises -- it is for everyone.
Most of all, we are having an absolute blast building this. Every new metric we add, every GameIQ we tune, every time our prediction nails an upset -- it reminds us why we started. Maine sports deserve world-class analytics. We are going to keep building until they have it.