
Your Record Is a Lie and We Can Prove It
We just launched something that has never existed in Maine high school sports. A proprietary metric called DSI, the Depth of Schedule Index, that measures exactly how difficult your schedule was. Not your record. Not your wins. Your schedule. Nine layers of analysis that tell the truth about whether you earned that record or had it gifted to you by a weak schedule.
DSI (n.) The number that separates "we went 14-2" from "yeah, but look who you played."
Why This Matters
Two teams can have identical records and completely different stories. A 12-4 team that played the top programs in the state every week earned those wins differently than a 12-4 team that scheduled cupcakes all season. Everyone knows this. Coaches argue about it. Parents debate it in the stands. Now there is a number that settles the argument.
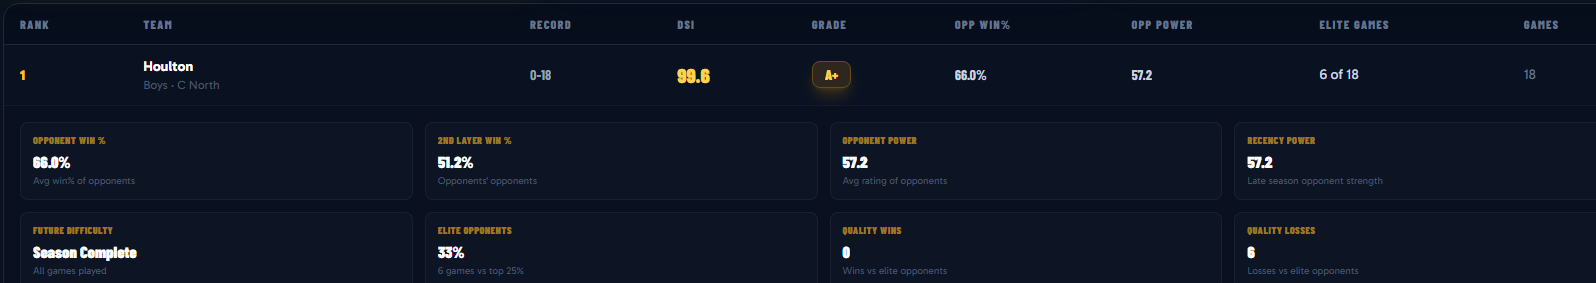
DSI does not care about your win percentage. A team that went 0-18 against the best competition in the state earns a higher DSI than an undefeated team that played nobody. Because DSI measures one thing: the difficulty of the path you walked.
Nine Layers Deep
Most schedule strength metrics look at one thing: your opponents' win percentage. That is layer one. We go eight layers deeper. Our small team built a proprietary system that analyzes opponent quality from multiple angles, weights recent games differently than early season games, accounts for future difficulty, and measures what percentage of your schedule was spent against elite competition versus everyone else.
We are not going to tell you exactly how we weight each layer. That is the proprietary part. But we will tell you this: no other platform in Maine is doing anything close to this level of analysis on schedule difficulty.
Where to Find It
Schedule Depth is in the navigation under Deep Dive for every team sport: basketball, hockey, soccer, baseball, softball, and football. Click it and you will see every team ranked by DSI with a letter grade from A+ to F.
Click any team to expand the full breakdown: opponent win percentage, second layer opponent analysis, Power Index Rating of opponents, recency weighting, future difficulty, and quality game distribution. Everything you need to understand exactly how tough that team's schedule was.
DSI also shows up on Team Center, Matchup Lab, and Power Index pages. When you are comparing two teams or evaluating a matchup, the DSI is right there telling you which team has been battle tested and which one has been coasting.
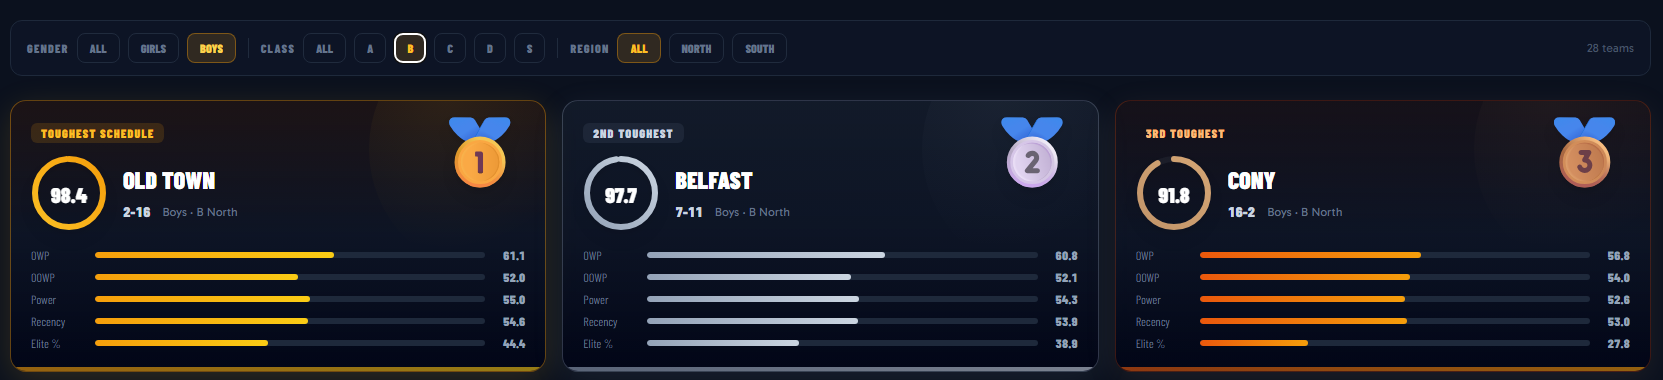
The Top 3 Get the Podium Treatment
The three teams with the toughest schedules in each sport get gold, silver, and bronze podium cards with score rings, medal badges, and component bar graphs. It is the same premium design treatment we use for The 207 rankings. Because surviving the hardest schedule in the state deserves more than a number in a table.
Updated After Every Game
DSI recalculates nightly. Every game result shifts the landscape. A big upset changes your opponents' win percentage which changes your DSI. A team that looked like they had an easy schedule in week three might have a completely different DSI by week ten after their opponents improved. The numbers are always current.
Baseball and Softball Start April 16
DSI is ready for baseball and softball the moment the first pitch is thrown on opening day. As games come in, the DSI scores will build and the true schedule difficulty picture will emerge. By mid season, we will know exactly which teams earned their records and which ones need to start scheduling better competition.
Your record tells a story. DSI tells you if it was fiction.