Your Freshman Self Just Got Compared to Your Senior Self and It Is Not Pretty (In a Good Way)
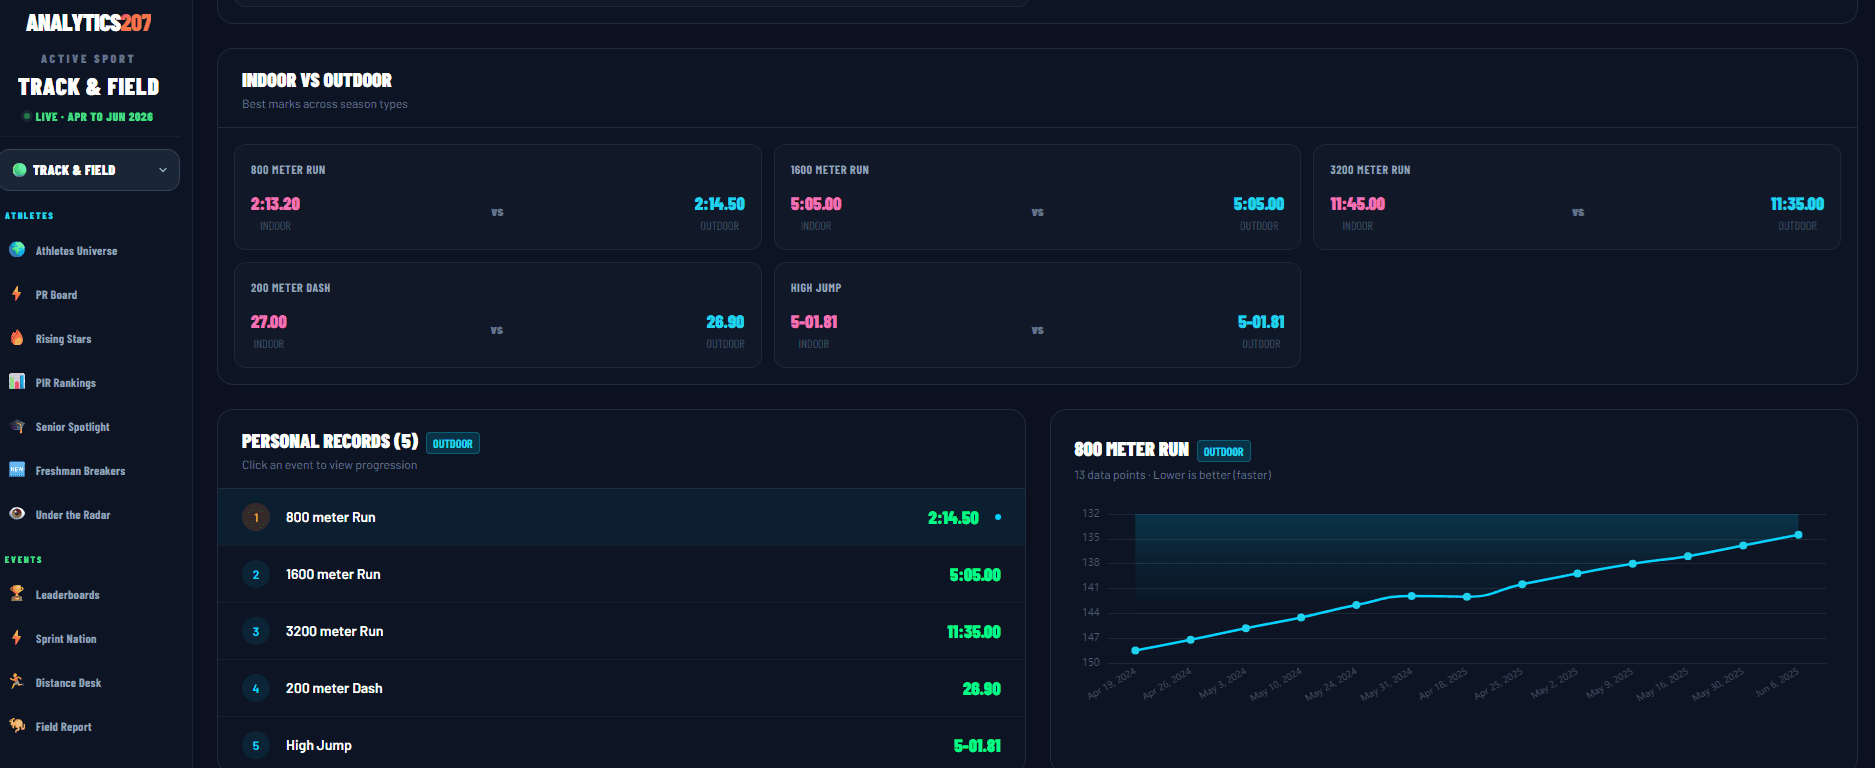
We just shipped something that we feel high school athletes are going to love. Season over season career progression tracking for every Track and Field athlete in the state. Indoor vs indoor. Outdoor vs outdoor. Year after year. Every event. Four full years of growth, visualized in one place.
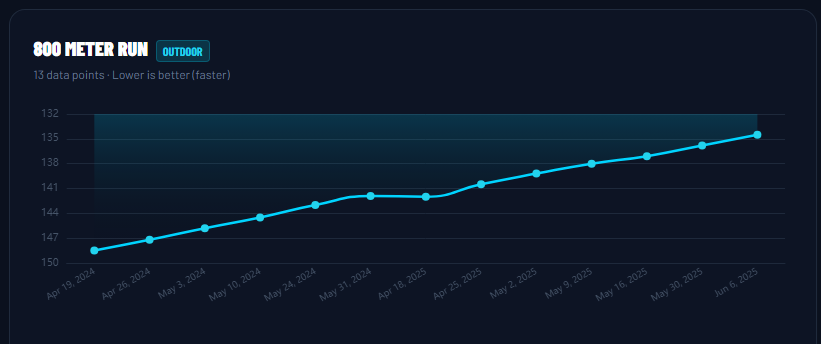
Your kid ran a 5:48 in the 1600 as a sophomore. Now they are running 5:05 as a junior. We do not just tell you that happened. We show you exactly when it happened, how much they improved each year, and what percentage faster they got. With charts. Big, colorful, impossible to ignore charts.
Where to Find It
Go to any athlete profile page in our Track and Field section. Search for an athlete in the Athletes Universe, click their name, and scroll down. You will see two new sections that did not exist yesterday:
Career Progression shows bar charts for every event the athlete competes in, broken out by year. Each bar is a different color representing a different season. The marks are printed right on the bars so you do not have to squint at axis labels like some kind of scientist. There is an improvement badge on each event showing the total gain from their first year to their most recent. Green means faster. You want green.
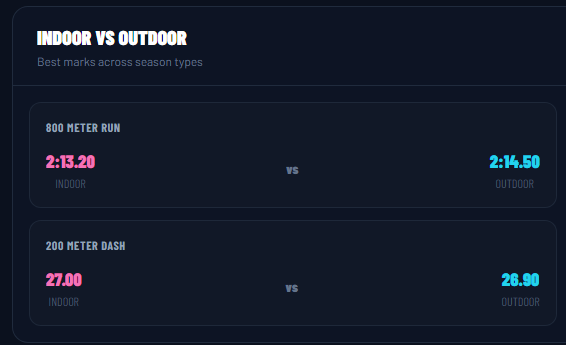
Indoor vs Outdoor shows a side by side comparison of their best indoor marks against their best outdoor marks. Because sometimes you want to know if your kid runs differently on a banked track versus actual sunlight.
Why This Matters
Coaches have been tracking this stuff on spreadsheets since the invention of spreadsheets. Parents have been keeping paper logs in binders that live in the back seat of their car. We just made all of that unnecessary.
Pull up an athlete. See every event. See every year. See the improvement. Share it. Screenshot it. Text it to the grandparents. Put it on the fridge. Whatever you do with data that makes you proud of a teenager, do that.
This Is Not Just About Bragging Rights
Although it is definitely also about bragging rights.
For coaches, this is a recruiting tool. You can pull up any athlete and show a college program exactly how much improvement they have made over their career. That 800 meter runner who went from 2:28 to 2:13 over two years? That trajectory tells a story that a single PR number never could.
For athletes, this is motivation. You can see the work paying off in real numbers. Not "I feel faster" but "I am 23 seconds faster than last year and here is the chart to prove it." That is a different conversation entirely.
How We Built This
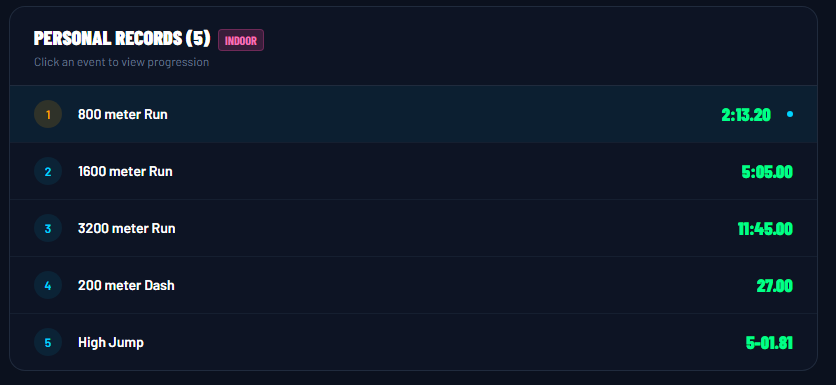
Our small team has been working overtime to make this happen. We collected every meet result, organized it by season (indoor separate from outdoor, because we are not animals), computed the best mark per event per academic year, and built visual comparisons that scale from one year all the way through a four year career.
The progression charts use normalized scaling so your 200 meter dash bars are just as visible as your 3200 meter bars. Nobody gets lost because they run a short event. Every event gets its own chart with full width bars, improvement deltas between years, and a total career improvement badge.
What Is Coming Next
Cross Country is next. Same concept: season over season progression tracking for every runner. How much faster did they get from junior year to senior year on the same 5K course? We are building it now.
After that, we are bringing career progression to every sport on the platform. Basketball, baseball, softball, hockey, soccer. If you compete in Maine high school sports and your stats exist, we are going to show you how much better you got over your career. Or, in some cases, how much work you still have to do. We do not sugarcoat.
Go Look at Your Athlete
Seriously. Go to Track and Field, search for your kid (or yourself if you are the athlete reading this), and look at the Career Progression section. If you have competed in multiple seasons, you will see the full timeline. If you only have one season so far, come back after this spring. The outdoor 2026 season starts in April and those numbers will populate automatically as results come in.
Your freshman year is permanent. Your senior year has not been written yet. The charts are waiting.